

Imagine standing on a remote hillside, hammer in hand, notebook stuffed with strike-and-dip readings, and a mind full of questions about the rock beneath your boots. Now, imagine returning to your desk, firing up your laptop, and watching that same hillside come alive on your screen with colorful layers showing rock types, fault zones, mineral deposits, and even groundwater flow paths. It’s GIS (Geographic Information System) revolutionizing the way geologists understand the Earth.
In a world overflowing with data, GIS has become a geologist’s best friend, blending the art of fieldwork with the science of digital analysis. In this blog, let’s dive deep into the applications of GIS in geology
What is GIS ?
GIS is a computer-based system that captures, stores, checks, and displays data related to positions on Earth’s surface. But for geologists, it’s so much more than just a fancy mapping tool. It allows us to layer different types of data like rock formations, faults, soil types, mineral samples, and satellite images and study the relationships between them. It’s like stacking multiple transparencies over a map to uncover hidden patterns, except those transparencies are smart, searchable, and interactive.
Why do geologists use GIS?
Because geology is inherently spatial. Every fault line, every mineral vein, every volcanic vent. it’s all connected to a location on the map. GIS helps geologists make sense of it all. Here’s how.
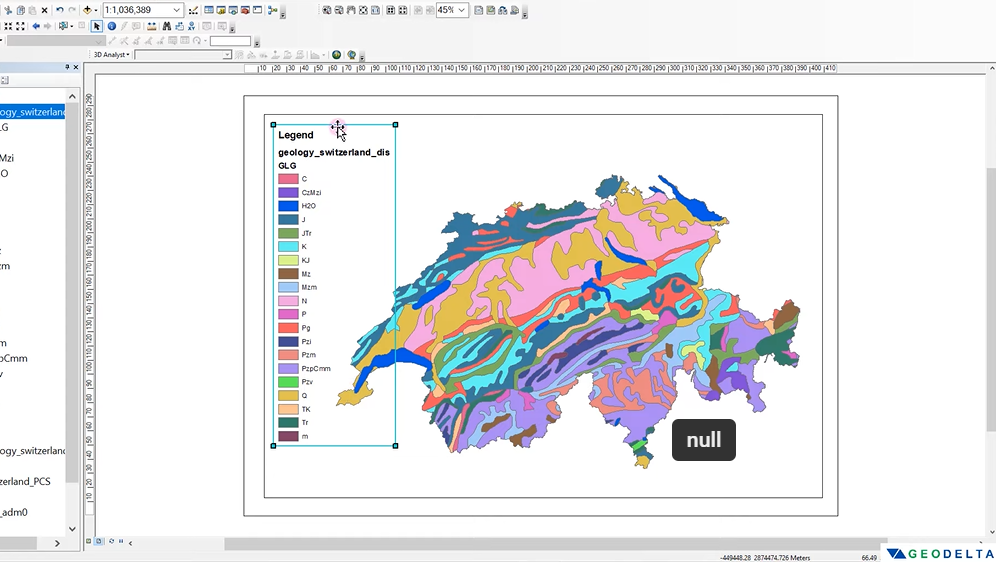
Geological Mapping:
Geological maps are the bread and butter of any field geologist. Traditionally, these were made by handtedious and time-consuming. With GIS, geologists can:
- Digitize and georeference paper maps.
- Overlay field observations directly onto base maps.
- Update maps in real-time using GPS tools.
- Combine rock types, structural data, and geomorphology in a single visual.
Field Example: A geologist mapping the Aravalli Hills in Rajasthan can input lithological data, record bedding planes using a mobile GIS app, and generate a full geological map by the time they return to camp.
Structural Geology
Strike and dip measurements, fold axes, and fault planes can be plotted on GIS maps to show structural trends. When combined with satellite imagery and elevation models, it helps reconstruct the tectonic story of a region. Plotting stereonets in GIS to analyze the orientation of joints and faults in a mining area, and assessing their impact on slope stability.
Mineral and Energy Exploration
Exploration geologists use GIS to analyze multiple datasets together: remote sensing images, magnetic surveys, radiometric data, and geochemistry. With this, they can:
- Identify zones with high mineral potential.
- Model ore body geometry.
- Track historical exploration data.
In uranium exploration across Proterozoic basins, GIS helps correlate airborne radiometric anomalies with litho-units and structural breaks to predict new mineralization zones.
Hydrogeology:
Water in the subsurface doesn’t flow randomly. it follows geological structures. GIS can be used to:
- Map aquifers and recharge zones.
- Analyze slope, soil permeability, and drainage.
- Model groundwater flow paths using DEM (Digital Elevation Models).
Scenario: In a drought-prone area, hydrogeologists use GIS to identify recharge zones by combining rainfall data, geology, and land use, helping communities plan sustainable groundwater use.
Natural Hazard Assessment
Geology isn’t always peaceful. Landslides, earthquakes, and volcanic eruptions, these hazards are deeply linked to the Earth’s structure and behavior. GIS helps manage risks by:
- Creating landslide susceptibility maps using slope, soil, and rainfall data.
- Identifying flood-prone zones from past events and topography.
- Monitoring fault activity using remote sensing data.
Application: In the Himalayan foothills, GIS has been used to map landslide-prone zones post heavy monsoons, helping authorities issue timely alerts and plan infrastructure accordingly.
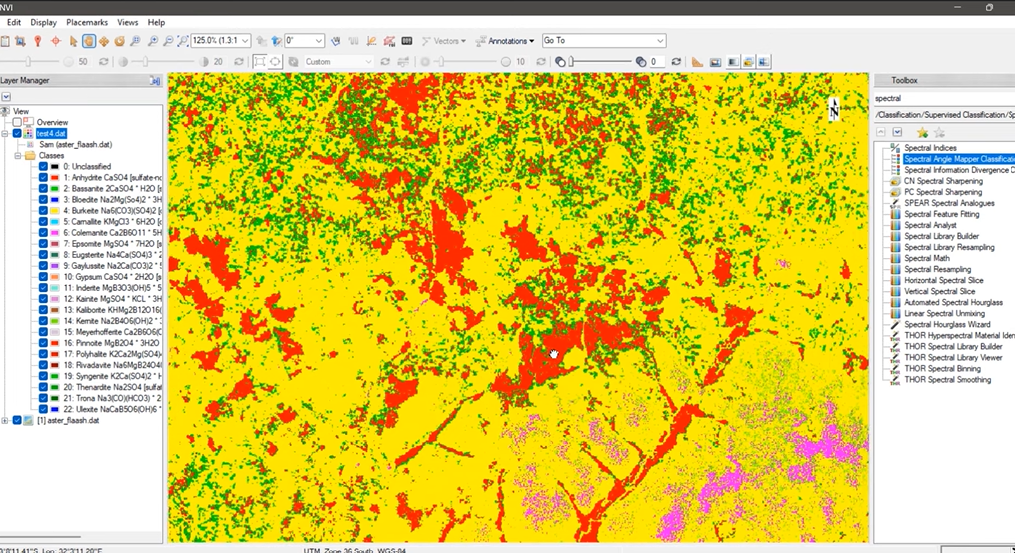
Remote Sensing and GIS: A Powerful Duo
Remote sensing provides the eyes in the sky, satellite images, spectral data, and aerial photography, while GIS provides the brains. Together, they’re used to:
- Identify alteration zones in mineralized regions.
- Map rock types in inaccessible terrains.
- Detect environmental changes due to mining or deforestation.
Example: ASTER or Landsat data analyzed in GIS can detect clay alteration associated with epithermal gold deposits, without setting foot in the field.
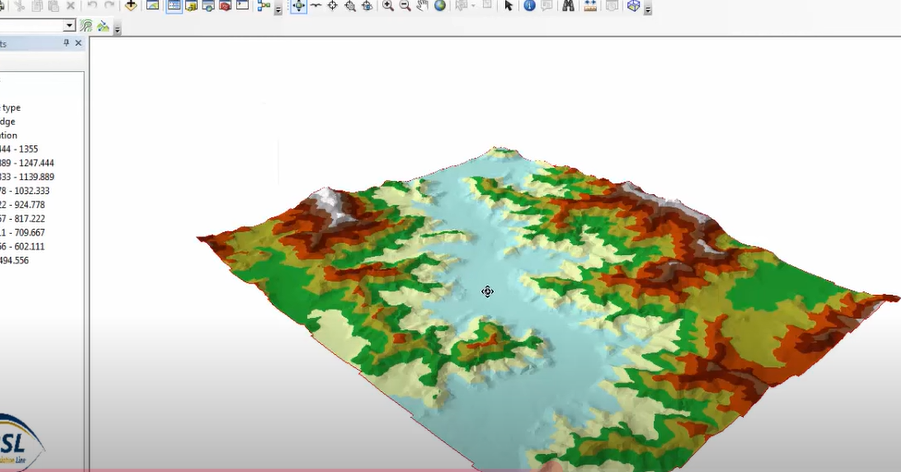
3D Modelling and Subsurface Visualization
Modern GIS can build 3D models of terrain and subsurface structures using borehole data, seismic sections, and topography. This is incredibly useful for:
- Designing tunnels or dams.
- Understanding basin architecture.
- Visualizing ore bodies.
Imagine: Visualizing a 3D block of your study area showing lithology, faults, aquifers, and drill holes—on your laptop. That’s real-time geological storytelling.
Geochronology and Spatial Analysis
Time and space go hand-in-hand in geology. GIS helps geologists visualize temporal data spatially:
- Mapping rock units by age.
- Tracking glacial retreat or river migration over centuries.
- Studying plate movements using GPS-based vector data.
Insight: Overlaying time-stamped geological events can reveal the evolution of basins, volcanism patterns, or paleogeographic reconstructions.
Tools Geologists Use in GIS
Here’s a quick rundown of tools and platforms popular among geologists:
| Software | Use Cases |
|---|---|
| ArcGIS | Advanced spatial analysis, standard in industry |
| QGIS | Free, open-source, customizable |
| RockWorks | Subsurface and borehole modeling |
| Surfer | 2D/3D gridding and contour mapping |
| Google Earth Pro | Quick location tagging and visualization |
Mobile GIS apps like Field Maps, Locus Map, or StraboSpot help geologists capture field data with GPS, photos, and notes.
Real-Life Applications: From Mines to Mars
GIS isn’t just for academics or researchers. It’s used across sectors:
- Mining Companies: To plan drilling, track ore bodies, and manage environmental compliance.
- Oil & Gas Industry: For seismic interpretation, pipeline routing, and reservoir modeling.
- Disaster Management Teams: To create vulnerability maps for quick response.
- Urban Planners: To assess geological risks before construction.
- Planetary Scientists: NASA uses GIS to study Mars’ topography and plan rover paths!
Learning GIS as a Geologist
Feeling inspired? Here’s how to get started:
- Start with QGIS: Free, community-supported, great documentation.
- Learn the Basics: Layers, shapefiles, projections, and attribute tables.
- Take Online Courses: ESRI Academy, Coursera, Udemy, or YouTube.
- Practice with Real Data: Download free geological datasets from USGS, Bhuvan, or OpenTopography.
Most importantly, apply it to your fieldwork. GIS becomes second nature when it connects to rocks you’ve touched and maps you’ve walked across.